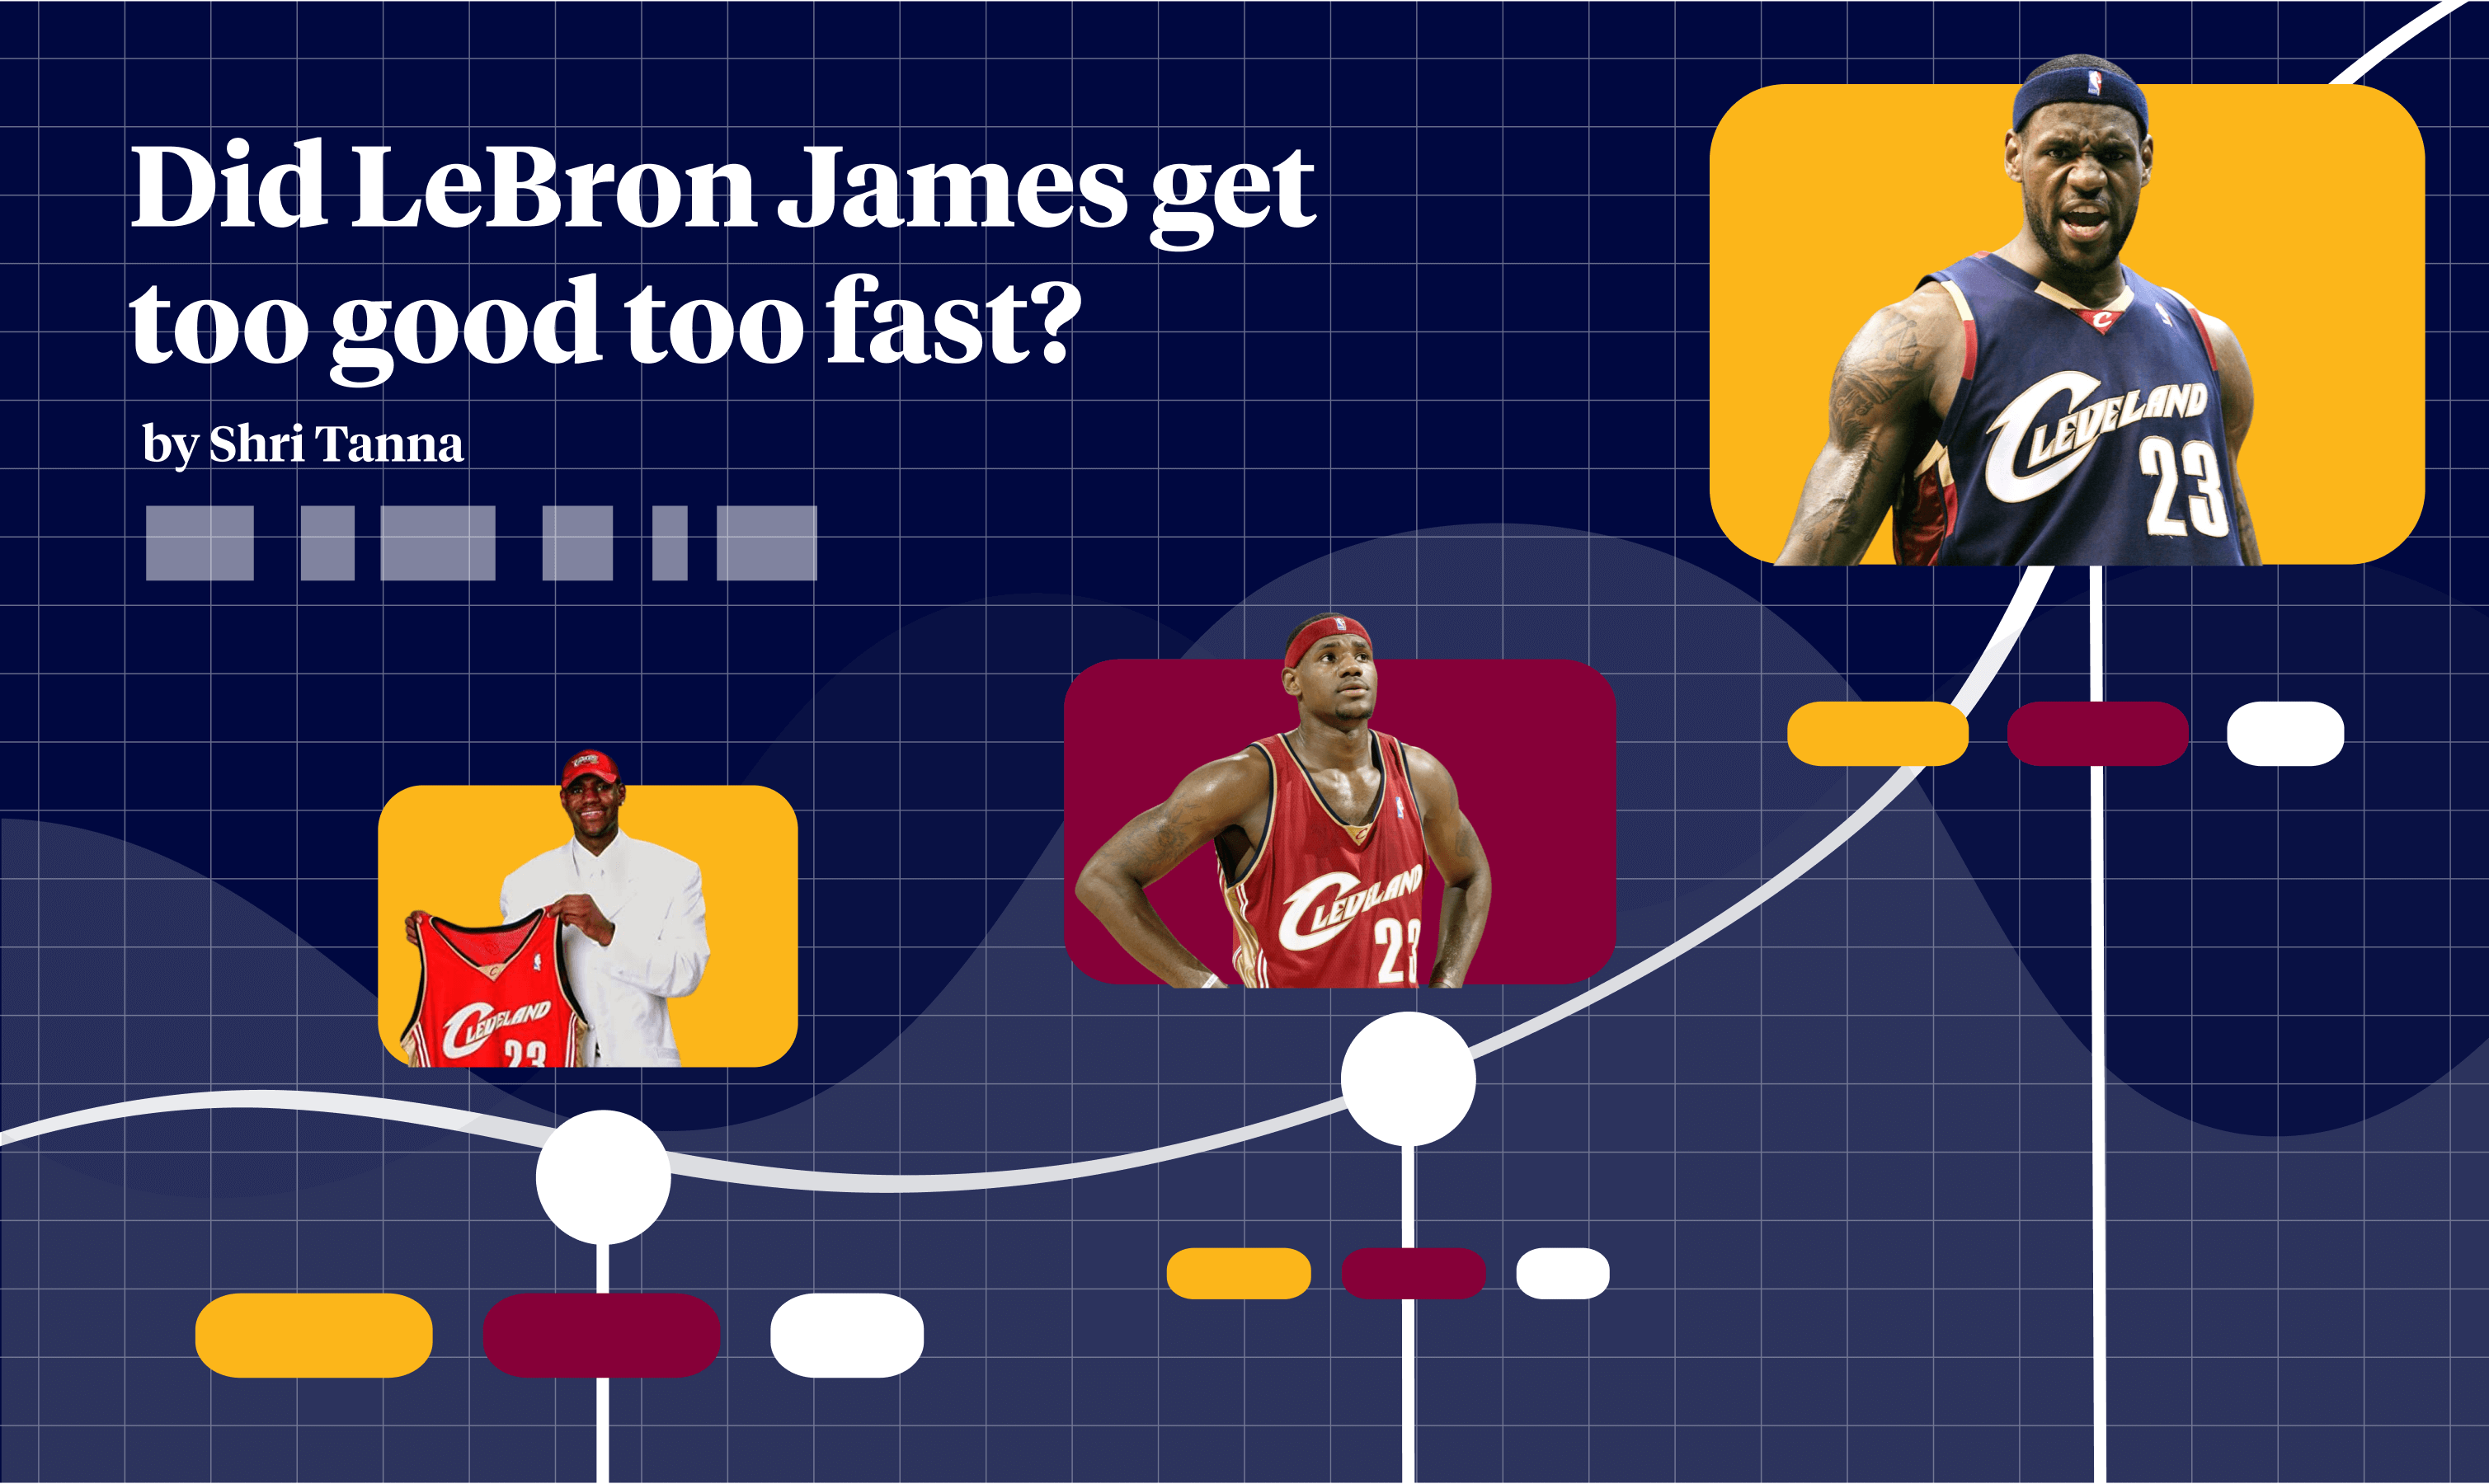

Shri Khalpada
I came to be a serious fan of basketball in the mid 2000s. Some of my earliest memories as a fan include watching LeBron James outduel Gilbert Arenas and my hometown Wizards in his first playoffs, scoring 25 straight against the Pistons in his fourth year, and his late-aughts duels against the Celtics Big 3. Although no team gets to 66 wins or makes the Finals solely because of a single player, his first Cleveland run is the best example I know of a player elevating a team beyond their top-to-bottom talent level.
I had a thought about LeBron and those Cavs teams: is it possible that LeBron got too good too fast? Two years after drafting LeBron, Cleveland was above .500. Three years had them above 50 games, and five years had them above 60. Did going from a lottery team to the top of the Eastern Conference so quickly come at the cost of a few years of good draft picks that most rebuilding teams go through?
There are too many variables here to come up with a definitive answer, but I'll walk through an alternate scenario where LeBron improves to his realized peak more steadily instead of exploding into the league as he did in his early years.
The Impact of #1 Picks
The metric is imperfect because it ultimately is just based on box score stats (check out our take on non-box-score stats), and because realistically there are diminishing returns on great players playing for average teams after a certain point, but for our purposes it should be good enough.
I grabbed WAR data from Basketball Reference for the eight #1 picks before him and after him, excluding players who missed significant time due to injury. Let's see what every player's first seven seasons (the length of LeBron's first Cleveland stint) look like:
An Alternate Trajectory
LeBron took a huge leap in WAR his second year, hovered in that range for a few seasons, and then put up the second greatest WAR of all time in his sixth year (see if you can guess who was first).As you can see in the above chart, there is a lot of variation in the trajectories for #1 players between injuries, major roster changes, just having an off year, etc. For this thought experiment, let's do the simplest thing possible and assume LeBron had a perfectly linear growth from his actual rookie campaign to his peak. This roughly follows the trajectory of some other #1 picks such as Dwight Howard and John Wall in their first seven years.
The rest of this essay is going to be more theoretical and for fun. Let's go year-by-year over LeBron's first Cleveland stint, and compare what actually happened with what might have happened using LeBron's hypothetical progression. To keep this at a reasonable level of complexity, I'm going to ignore variables like injuries and trades, and focus on changes in the first round of the draft.
Year 1 (2003-04)
| Record | First Round Pick | |
|---|---|---|
| Actual | 35-47 | Luke Jackson (10) |
| Hypothetical | 35-47 | Luke Jackson (10) |
This one is easy! Our hypothetical LeBron has the same rookie year and the Cavs make the same draft pick as they did in reality.
Year 2 (2004-05)
| Record | First Round Pick | |
|---|---|---|
| Actual | 42-40 | None |
| Hypothetical | 29-53 | None |
Our hypothetical Cavs record this year comes from taking the difference between LeBron's actual second year WAR and our hypothetical second year WAR, and subtracting it from the team's actual record that year.
Cleveland's first round pick this year belonged to Phoenix (and was then traded to Charlotte) from a trade in 1997. That doesn't change in our hypothetical scenario.
Not much has actually changed yet between reality and our scenario here, except that LeBron's ascent to the top of the NBA is slower.
Year 3 (2005-06)
| Record | First Round Pick | |
|---|---|---|
| Actual | 50-32 | Shannon Brown (25) |
| Hypothetical | 40-42 | Rajon Rondo (15) |
The hypothetical record here is calculated exactly the same way as above, using the difference between LeBron's third year WAR with the hypothetical third year value.
This gives them a record of 40-42, which is the same as Milwaukee that year. To keep things simple, let's just assume the tiebreakers here worked out in a way that gave hypothetical Cleveland the same draft position as actual Milwaukee. Milwaukee had the 15th pick, which was traded earlier in the season to the Hornets. Let's assume Cleveland held onto their pick.
I'm going to apply hindsight bias here and assume ideal drafting. The two most interesting players that are available to Cleveland hypothetically at pick #15 are Rajon Rondo and Kyle Lowry. This was a couple years before a trade that brought Mo Williams to Cleveland, so the Cavs were thin at the PG position. They needed a replacement for Eric Snow in the twilight years of his career. Cole Burwell's 2004 scouting report of Rondo describes him as a "lightning quick point guard with the ability to penetrate seemingliy at will" as well as a willing passer. Hypothetical Cleveland takes some of the scoring and playmaking pressure off of LeBron and decides to go with Rondo!
Actual Cleveland lost in 7 to Detroit in the second round this year.
Year 4 (2006-07)
| Record | First Round Pick | |
|---|---|---|
| Actual | 50-32 | None |
| Hypothetical | 50-32 | None |
Here's where things get a little more tricky. So far, we've been calculating Cleveland's hypothetical record by taking the difference between LeBron's actual and hypothetical impact, and we've eliminated factors like injuries and trades to keep things simple. At this point in the thought experiment, however, the Cavs have drafted Rondo.
Let's assume that Rondo's rookie year production on hypothetical Cleveland is the same as his rookie year production on actual Boston. There are a number of possible reasons this wouldn't be true, but it seems like a reasonable assumption for this experiment. Rondo's rookie WAR was about 2, and given that he would be coming into a guard rotation on Cleveland that needed help, let's assume that he actually did add 2 wins. Shannon Brown didn't play much during his rookie year, so subtracting his overall impact (since he didn't go to Cleveland in this hypothetical) doesn't change things much.
Using those 2 wins and our usual calculation for LeBron gives us a record of 50-32, the same as their actual record! Put in other words, LeBron's linear trajectory here has almost caught up to his actual production at this point in his career, and the small difference is offset by hypothetical rookie Rondo's production.
Actual Cleveland did not have any draft picks this year. They traded their first round pick to Charlotte in 2004, and we'll assume that also happened in our scenario.
Actual Cleveland got swept in the NBA finals by the Spurs this year.
Year 5 (2007-08)
| Record | First Round Pick | |
|---|---|---|
| Actual | 45-37 | JJ Hickson (19) |
| Hypothetical | 49-33 | JJ Hickson (22) |
Using the same logic as we did in the previous year shows us that hypothetical Cleveland had a better year than actual Cleveland. Rondo's second year WAR is about 6.5, and hypothetical LeBron is still only about 3 WAR behind actual LeBron. The math gives us that hypothetical Cleveland is 4 games better, giving us a record of 49-33.
Hypothetical Cleveland slides down a few spots in the draft. Let's assume JJ Hickson was still on the board and Cleveland makes the same pick they did in real life.
Actual Cleveland lost to actual Boston in a tough 7 games series in the second round of the playoffs this year, but Rondo has swapped teams in the hypothetical.
Year 6 (2008-09)
| Record | First Round Pick | |
|---|---|---|
| Actual | 66-16 | Christian Eyenga (30) |
| Hypothetical | 70-12 | Christian Eyenga (30) |
Hypothetical Cleveland dominates the regular season this year. LeBron is not quite where he was at when he put up his all-time season in 2009, but he's not far off at only 4 WAR behind.
Rondo's third year WAR on actual Boston was about 11. I'm skeptical it would have gotten that high that quickly in Cleveland, as he would have split playmaking duties with LeBron. Let's assume it was closer to 8 in our scenario.
Hypothetical Cleveland has the best regular season in the league, just like their real-life counterparts. They also draft Christian Eyenga with the last pick in the first draft.
Actual Cleveland lost to Orlando in the Eastern Conference Finals this year.
Year 7 (2009-10)
| Record | First Round Pick | |
|---|---|---|
| Actual | 61-21 | None |
| Hypothetical | 73-9 | None |
Hypothetical Cleveland, again, dominates this year. Our trajectory for LeBron has him at his WAR peak in year 7 at an absurd 31.8. Actual Rondo makes his first all-star appearance and posts a similar WAR as the year before, so we assume hypothetical Rondo follows suit. Taking their combined impact into account gives us a 12 game improvement over actual Cleveland, for a total of 73 wins.
73-9 breaks the NBA record! Could adding Rondo as LeBron's teammate in Cleveland make them the best regular season team in NBA history? I doubt it. Using statistics to directly map a player to a win total is a decent heuristic, but starts to break down after a certain point because it doesn't handle the idea of diminishing returns well. There are also other factors here, like the possibility that they would have rested their starters after they wrapped up the #1 seed. It is interesting to think about though - Rondo at this point was close to entering his prime, LeBron was fully in MVP mode, and actual Cleveland did just win 66 games!
Actual Cleveland traded their first-round pick this year to the Wizards as part of a multi-team trade, so we'll assume the same happened to hypothetical Cleveland.
Like in 2008, actual Cleveland lost to Boston in the second round, but Rondo is still swapped in the hypothetical.
Final Thoughts
Let's review the differences between reality and our thought experiment:
When I first thought about this idea, I thought Cleveland would be a bit worse for a bit longer and be able to get more first round picks throughout the seven years. Instead, they really only ended up drafting Rondo and still being dominant. A few takeaways:
- Slowing down LeBron's trajectory only gave Cleveland a significantly better draft pick one year.
- Cleveland had traded more of their first round picks in these years than I had realized.
- Cleveland drafting Rondo basically offset us making LeBron's ascent slower.
- If Cleveland had drafted a worse player than Rondo, or if Rondo didn't succeed in Cleveland like he did in Boston, they may have had a better pick in 2008.
- It's hard to say whether Cleveland would have won a finals in any of these scenarios, but given this "best case" scenaro we've explored, I would bet they win at least one or two.
Overall, there are tons of complex variables we didn't take into account here, but it was a fun thought experiment and simulation to play out.
I hope I haven't offended too many Cavs or Celtics fans with the image of LeBron and Rondo succeeding together, although I guess the 2020 Lakers may have already done that 🙂
We're just getting started.
Subscribe for more thoughtful, data-driven explorations.