The Great MVP Race
Building a machine learning model to predict the future and evaluate the past of the NBA's most valuable players

Rob Moore
Growing up, Sunday mornings meant the big weekly edition of the Baltimore Sun. The one with all the sports statistics a 6 year-old could want - player leaderboards across the NBA, NFL, NHL, and MLB, all in one place. Being a Philly fan, I would always look forward to seeing Allen Iverson at the top of the points per game list.
In 2022, I no longer need to run out onto an ice-cold driveway to find the statistics I'm looking for. The NBA and NFL in particular have done a remarkable job compiling and cleaning data, and making it publicly available. And better yet, this eruption in data has been accompanied by groundbreaking methods for making sense of it all, including outstanding open source tools like scikit-learn, TensorFlow, Project Jupyter, and many, many more.
With the end of the NBA regular season growing nigh and the postseason bearing down, I thought it would be the perfect time to do an in-depth analysis of the league's most prestigious award - the Most Valuable Player (MVP). Below, I'll walk you through the creation of a machine learning model which can both predict future MVP winners and evaluate past results. It has been written keeping in mind not machine learning experts, but sports fans with a love of statistics. I know how much my love of sports provoked my love of math, and I would love to pass that along through clear and compelling studies.
The Decision (Tree)
At the center of our machine learning model is a “decision tree”. It’s similar to playing a game of 20 questions to try to figure out whether a player will win (or did win) the MVP award based on a series of yes or no questions. “Did the player score more or less than 25pts per game?” “Did the player’s team place in the top 3 seeds?” “Did the player shoot more or less than five 3-pointers per game?” “Did he make more or less than 40% of those 3-point attempts?”
Based on the answers to each question, the decision tree decides which question to ask next, eventually making a decision about whether the player will win (or did win) the MVP award.
To build a decision tree to answer the question “how likely is insert player to win the MVP?”, we start with training data – in our case, a series of stat lines and corresponding “labels” which tell us if the player with that season stat line won the MVP award or not. Using a Gini Index, we can calculate the best questions to ask to separate the MVP winners from the non-MVP winners. For instance, “Did a player’s team win more than 70% of its games?” is a great question to ask. “Did a player average more than 15pts per game?” is a comparatively poor question because many non-MVPs average more than 15pts per game each year. Even if the answer is yes, it doesn’t tell us a lot.
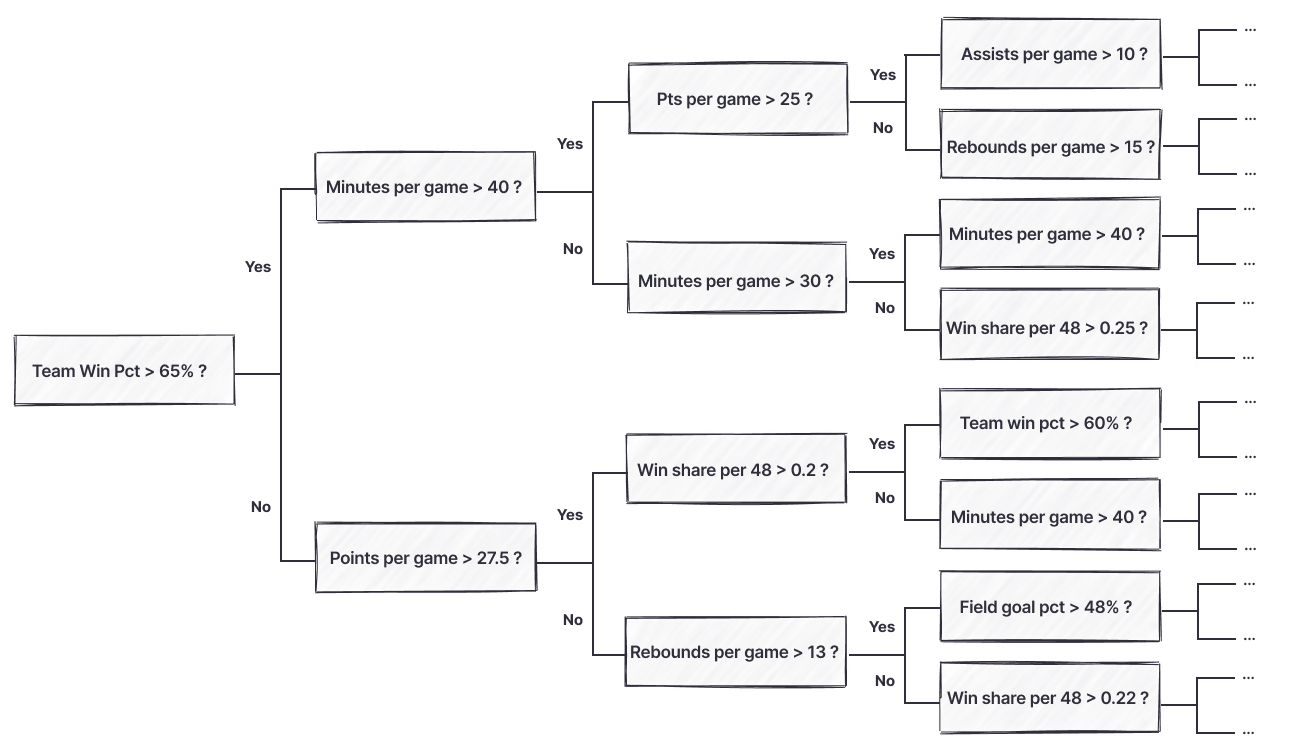
We can decide what the best next question is to ask at any time. For instance, if a player shot more than 6 3-pointers per game, we may next want to ask if their 3-point shooting percentage is above 40%. If they shot less than six 3-pointers per game, it may be more relevant to ask a question about rebounding numbers. Below, you can see an example decision tree:
Because we only have about 25 years’ worth of data to look at, it’s actually possible to come up with a series of questions which will accurately identify the MVP for each year with only 9 questions. The result ends up looking like the cherry-picked stats you’ll see ESPN post. For example, “Did the player shoot have shoot more than 42.5% from 3, score more than 30.1 ppg, and shoot 90.5% or better from the line?” This overly specific series of questions will accurately identify 2016 Steph Curry as the MVP. But, as you might guess, it doesn’t generalize well. We need to look no further than 2021 Steph Curry, who put up nearly identical numbers and will also qualify under these criteria.
As a human looking at this, we know the difference between 2016 Steph and 2021 Steph is that his 2016 Warriors were one of the greatest teams of all time, and his 2021 Warriors struggled to stay around .500. But, because our machine learning model only has a small amount of data to train on, it doesn't know to ask a follow up question about the team's overall success. To date, there haven’t been any historical examples of a player shooting that well, scoring that much, and not winning the MVP, so it wasn’t necessary to ask any follow up questions. This is an example of the notorious problem of what’s called “overfitting” the data. It looks like cherry picked stats which are able to correctly identify past MVP winners, and it does not generalize well.
Typically, the fix for overfitting is to pour more data into the machine learning model. In an ideal world, machine learning models are trained on tens of thousands if not millions of data points. But, we can’t do that here - we only have 38 years worth of data with at most 12 data points per year - a mere 362 data points in all. So, we need to squeeze the most we can out of them. In the next section we're going to explore how to do that.
Building a forest of trees
Take a complex problem like predicting the NBA MVP. If you ask a random basketball fan who they think is going to be the MVP, there’s a solid chance they will tell you the wrong answer. Every fan has their own biases – the team they cheer for, the stats they think are important, the games they’ve watched, and the playing style they like to name a few.
If, instead, you ask 100 fans who they think will win the MVP and take the aggregated answer, you’re much more likely to get an accurate result. When we combine the opinions of 100 people, the biases amongst individual fans start cancelling out, and we’re left with less bias overall.
It is possible that the many, though not individually good men, when they come together may be better, not individually, but collectively
Aristotle
Within the machine learning world, the “wisdom of the crowd” is called “ensemble learning”. Instead of training one decision tree and using that as the be-all and end-all, we train a forest of decision trees on different random subsets of the data. And when we want to predict this year’s MVP winner, we don’t just ask one tree, but the forest of trees. Despite the simplicity of this model, it is one the most powerful and popular machine learning models used today. It also helps us with our overfitting problem. Since each model sees a different subset of the data, our forest of decision trees will be diverse. While each may do some cherry picking, when combined, just like individual fan biases, these will cancel out and leave us with more generalized criteria.
Making use of every data point
The naïve approach, and one that we see repeated quite often in other publications, is to take a player’s stats for the year and predict whether that player won the MVP award (note that we don’t use naïve here to speak about the publishers, but in the computer science context meaning “taking no other information into account”). What this looks like is:
| Year | Player | Won MVP |
|---|---|---|
| 2019-20 | Giannis Antetokounmpo | Yes! 🥇 |
| 2019-20 | LeBron James | No |
| 2019-20 | James Harden | No |
| 2019-20 | Luka Dončić | No |
| 2019-20 | Kawhi Leonard | No |
| 2019-20 | Anthony Davis | No |
| 2019-20 | Chris Paul | No |
| 2019-20 | Damian Lillard | No |
| 2019-20 | Nikola Jokić | No |
| 2019-20 | Pascal Siakam | No |
| 2019-20 | Jimmy Butler | No |
| 2019-20 | Jayson Tatum | No |
If we're using the data like this, then our machine learning model will lump in LeBron James' 2019-2020 season with Jayson Tatum's 2019-2020 season. Intuitively, this doesn't make sense. While Tatum put up a great year, LeBron's season was markedly more impressive, and not informing our machine learning model about this would be a shame! Luckily for us, we can fix this. We don’t just know who won the MVP, we know the MVP “vote share” that each player received in a given year. So, instead of asking did this player win the MVP, we can look at players within a given year and ask who was more deserving of the MVP award that year. That is, we take very pairwise combination of players and ask our decision trees to predict who received more votes that year.
| Year | Player | Rank |
|---|---|---|
| 2019-20 | Giannis Antetokounmpo | 1st |
| 2019-20 | LeBron James | 2nd |
| 2019-20 | James Harden | 3rd |
| 2019-20 | Luka Dončić | 4th |
| 2019-20 | Kawhi Leonard | 5th |
| 2019-20 | Anthony Davis | 6th |
| 2019-20 | Chris Paul | 7th |
| 2019-20 | Damian Lillard | 8th |
| 2019-20 | Nikola Jokić | 9th |
| 2019-20 | Pascal Siakam | 10th |
| 2019-20 | Jimmy Butler | 11th |
| 2019-20 | Jayson Tatum | 12th |
Taking the 2019-2020 season, we can take our original 12 data points and transform it into 132 pairwise comparisons. This scales our dataset size by more than 10x for our data hungry machine learning model!
This ranking system also helps us to look at the award within the context of each season. Winning the MVP award in any given year is a remarkable feat, but some years it is more impressive than others. A similar performance may win you the award one year, but only get you second or third place in another year. Take for instance James Harden in 2017 (MVP to Russell Westbrook), or Michael Jordan in 1997 (MVP to Karl Malone), or LeBron James in 2011 (MVP to Derrick Rose). These “2nd place” efforts could have very well won each players the award in surrounding years, but the competition for that year was particularly impressive.
In summary, by looking at MVP race rankings instead of the binary win/loss outcome:
- We’re now looking at the MVP race within the context of a given year
- We’re now using the entire range of ranking data available to us. Not just "1st place" or "not 1st place", but looking at the precise ranking from 1st place down to 12th.
We’ve solved an inter-year context problem and increased our number of data points from 362 to over 3000!
Results
Now for the exciting part. We can run our model to predict this year's MVP winner, and also to look at past awards and see how the model would ranked the top candidates for each of the past 38 seasons.
Not only do we get a prediction for the favorite to win MVP, we also get a candidacy score for each player. A higher score indicates a stronger likelihood to win the most valuable player award at the end of the regular season. The candidacy score for most eventual winners is between 2 and 4.5. The highest score of the past 38 seasons is LeBron James' 2008-2009 campaign, coming in at a 4.49! On the other end of the spectrum, Steve Nash won with a score of 1.1 in 2004-2005, lowest amongst the past 38 MVPs.
As we discussed above, by introspecting the data, our machine learning model will figure out the best questions to ask to predict how a player will stack up for the MVP award. Our model saw these as the strongest predictors of the MVP award:
Note that some features are naturally correlated with others. For example, total field goal % is influenced by 2-point field goal % and 3-point field goal %. As a result, if the model can infer most of what it needs from a subset of correlated features, the information gained from related features may be reduced, resulting in a lower f-score. This, of course, does not mean that those stats aren't important, just that they have a low orthogonality to other available stats. This explains why offensive and defensive RAPTOR scores have relatively low f-scores. While they are good summary metrics, most of what they accumulate is already accounted for with other stat lines. Observe also that both team win pct % and the team seed are in the top three features - speaking volumes to the importance of team performance for the MVP award.
Our model's predictions for the winner matched the actual league MVP 32 of the past 38 years (84%). We've picked out a couple of the more interesting and recent races below to see how our model matches up to the voters.
2016 - 2017 NBA MVP
This was the closest, and probably most heated, MVP race in recent years. Russell Westbrook put up a record setting year averaging a triple double over the course of the season. But his Thunder finished 6th in the West at 47-35. Harden led his Rockets to a 55-27 record, good for 3rd in the West, and finished with 29.1 ppg and 11.2 apg. Our model has a neck and neck race, but with Harden narrowly edging out Westbrook. Models do a reasonably good job of approximating quantifiable things, but the historical context of Westbrook's season is harder to quantify and made him a deserving choice in an otherwise close race.
2010 - 2011 NBA MVP
LeBron James was coming off back-to-back MVPs heading into the 2010-11 season. There is no doubt that Derrick Rose put together a spectacular season with less help than LeBron had in Miami, but some question whether "voter fatigue" played a role in him winning the MVP. Our model has LeBron narrowly edging out Rose.
2004 - 2005 NBA MVP
Shaquille O'Neal has been on record subtly hinting that he should have gotten the nod in the 2004-05 season, and our model agrees, ranking him first in an extremely close race. Steve Nash scored only a 1.09 from our model, but went home with the award. This mark ranks lowest amongst MVP winners from 1984-2020.
1999 - 2000 NBA MVP
Shaquille O'Neal probably should have won the MVP award in 1999-2000 by a unanimous vote. This was the largest margin of victory observed by our model across the 38 years analyzed. Allen Iverson, somewhat notoriously, received one first place votes amongst the ballots in 2000.
1996 - 1997 NBA MVP
Michael Jordan had a legitimate shot at MVP in most of the seasons he played. Some suspect voter fatigue played a role in the 1996-97 race between him and Karl Malone, but our model has Malone winning by a decent margin after putting up a great season for the Utah Jazz. Of course, Jordan and the Bulls would go on to win the championship over Malone's Jazz that year, with Jordan bringing home his 5th Finals MVP trophy.
1989 - 1990 NBA MVP
The 1989-90 year was filled with incredible individual seasons. Our model scored the 3rd place vote finisher, Michael Jordan, at a 1.91, 2nd place Charles Barkley at a 2.26, and Magic Johnson, the eventual award winner, at an impressive 3.51.
Explore 1984 - 2020
We encourage you to explore our model results for the past 38 NBA seasons! As you have probably gathered, the MVP winners are outlined in gold and the 2nd place player is outlined in silver. You can hover over a player to see the exact score our model gave them for that season.
Predicting the 2022 - 2023 NBA MVP
And the winner projected by PerThirtySix is: Joel Embiid!
We really appreciate all of your support for PerThirtySix! You can follow us on Twitter at @PerThirtySixers or author Rob Moore at @robmoo_re.
We're just getting started.
Subscribe for more thoughtful, data-driven explorations.