Featured
Updates Daily •Interactive
The Communal Plot
Answer a new question every day and watch as your response joins others to create a living, evolving data visualization that updates in real-time.
By Shri Khalpada and Rob Moore
 Larry FitzgeraldCardinals
 Julio JonesFalcons
 Ed ReedRavens
 Bruce SmithBills
 Luke KuechlyPanthers
 Walter PaytonBears
 Ja'Marr ChaseBengals
 Jim BrownBrowns
 Deion SandersCowboys
 Champ BaileyBroncos
 Barry SandersLions
 Charles WoodsonPackers
 J.J. WattTexans
 Peyton ManningColts
 Fred TaylorJaguars
 Travis KelceChiefs
 LaDainian TomlinsonChargers
 Aaron DonaldRams
 Mike HaynesRaiders
 Dan MarinoDolphins
 Randy MossVikings
 Tom BradyPatriots
 Drew BreesSaints
 Lawrence TaylorGiants
 Darrelle RevisJets
 Reggie WhiteEagles
 Rod WoodsonSteelers
 Steve LargentSeahawks
 Jerry Rice49ers
 Derrick BrooksBuccaneers
 Earl CampbellTitans
 Darrell GreenCommandersLarry FitzgeraldCardinalsPLAY ▸
Answer a new question every day and watch as your response joins others to create a living, evolving data visualization that updates in real-time.
By Shri Khalpada and Rob Moore
PLAYAnswer a new question every day and watch as your response joins others to create a living, evolving data visualization that updates in real-time.
By Shri Khalpada & Rob Moore
 PLAY
PLAYAll 2,309 words interactively laid out.
By Shri Khalpada
 PLAY
PLAYExplore 9 generations of Pokémon. Filter by type and stats, and scout any Pokémon by using the interactive visualization.
By Shri Khalpada
 PLAY
PLAYAn interactive 3D view of the roads and metro stations of Washington, DC.
By Shri Khalpada
 PLAY
PLAYTest your rhythm and timing in Drumroll! Press keys faster and faster to achieve the highest score. How many presses can you achieve before the sequence breaks?
By Rob Moore
 PLAY
PLAYExploring streaks on Jeopardy since the 5-day win cap was removed.
By Shri Khalpada
 LEARN
LEARNHow Victorian railway semaphores evolved into modern traffic systems.
By Shri Khalpada
 LEARN
LEARNHow a giant nuclear reactor in the sky and some silicon makes electricity, and why that's the easy part.
By Shri Khalpada
 LEARN
LEARNHow audio fingerprinting and a connect-the-dots trick lets Shazam identify a song in seconds.
By Shri Khalpada
 LEARN
LEARNHow geometry, stopwatches, and Einstein's theories work together to make GPS possible.
By Shri Khalpada
 LEARN
LEARNHow black-and-white squares encode URLs, error-correct themselves, and survive coffee stains.
By Shri Khalpada
 LEARN
LEARNInteractively explore lottery probabilities and simulate thousands of tickets in seconds.
By Shri Khalpada
 LEARN
LEARNSimulate the probabilities of shared birthdays in a group.
By Shri Khalpada
 LEARN
LEARNVisualize elevation data with a 3D globe.
By Shri Khalpada
 LEARN
LEARNTo betray, or not to betray?
By Shri Khalpada
 LEARN
LEARNInteractively explore how different voting systems can yield different outcomes.
By Shri Khalpada
 NBA
NBAA way to visualize passing on your favorite NBA team.
By Shri Khalpada & Rob Moore
 NBA
NBACreate highly customized and interactive shot charts for the NBA.
By Shri Khalpada & Rob Moore
 NBA
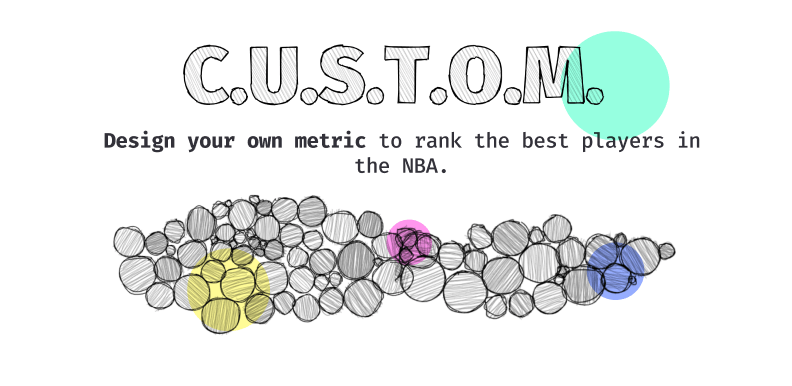
NBADesign your own metric for ranking the best players in the NBA.
By Shri Khalpada & Rob Moore
 NBA
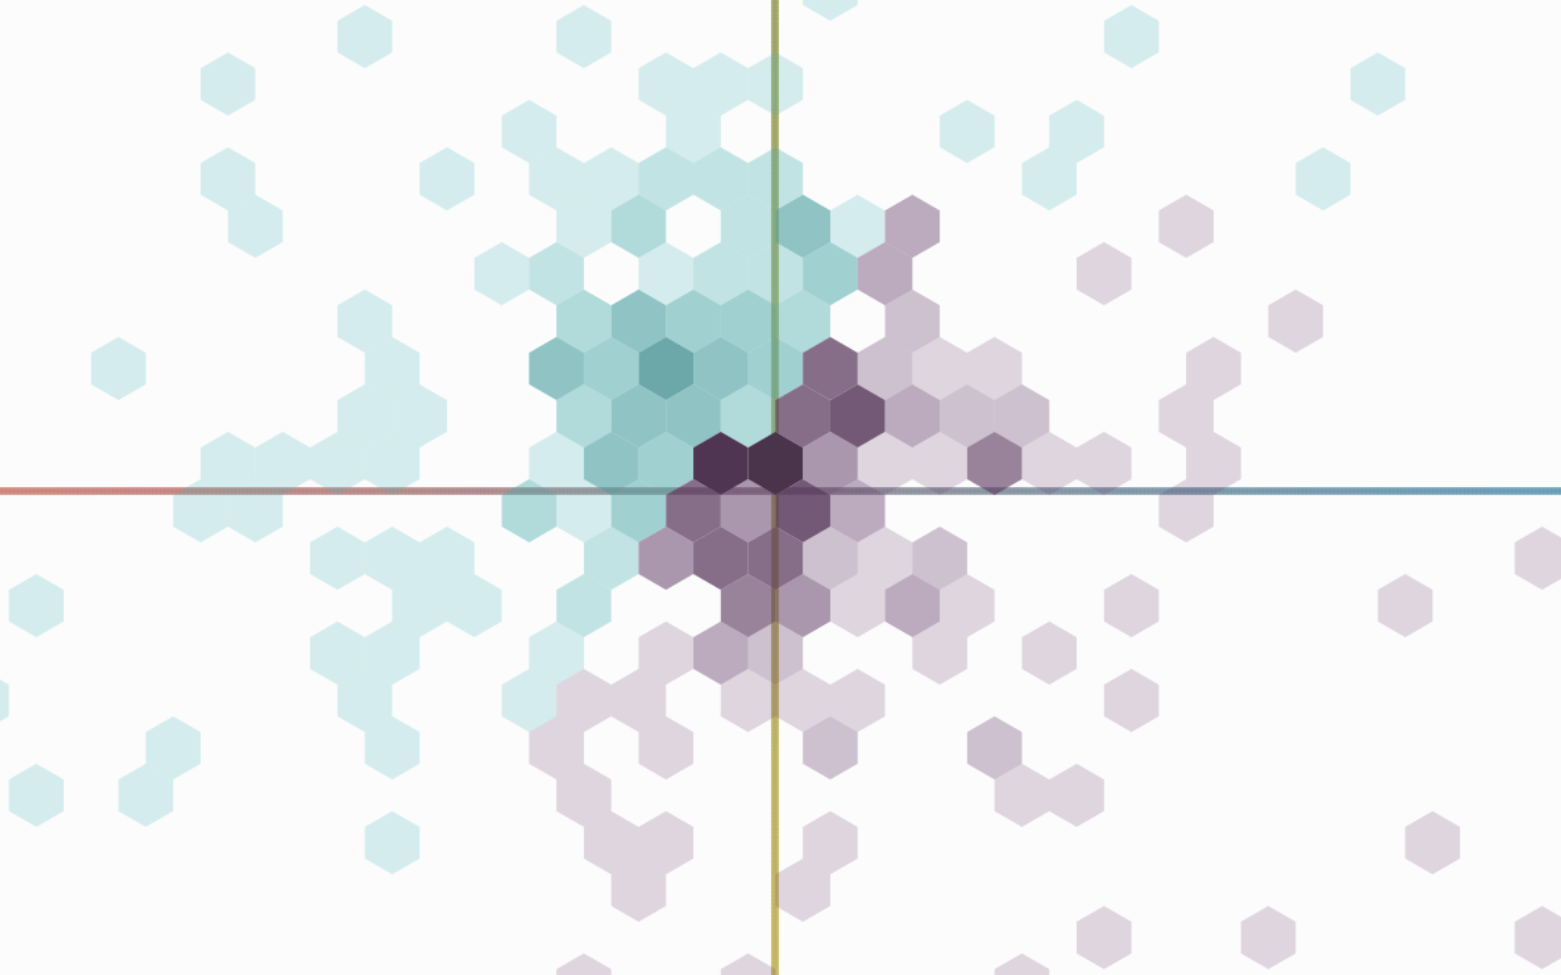
NBADesign your own metric to capture the things that don't normally show up on the box score.
By Rob Moore & Shri Khalpada
 NBA
NBAThe number of fans allowed at each stadium in the 2021 NBA Playoffs.
By Rob Moore
 NBA
NBABuilding a machine learning model to predict the future and evaluate the past of the NBA's most valuable players.
By Rob Moore
 NBA
NBAWhy a less surprising shot can be more impressive than a wilder one, and what information theory says about it.
By Rob Moore
 NBA
NBASome non-trivial tips to win your NCAA Tournament prediction pool.
By Rob Moore
 NBA
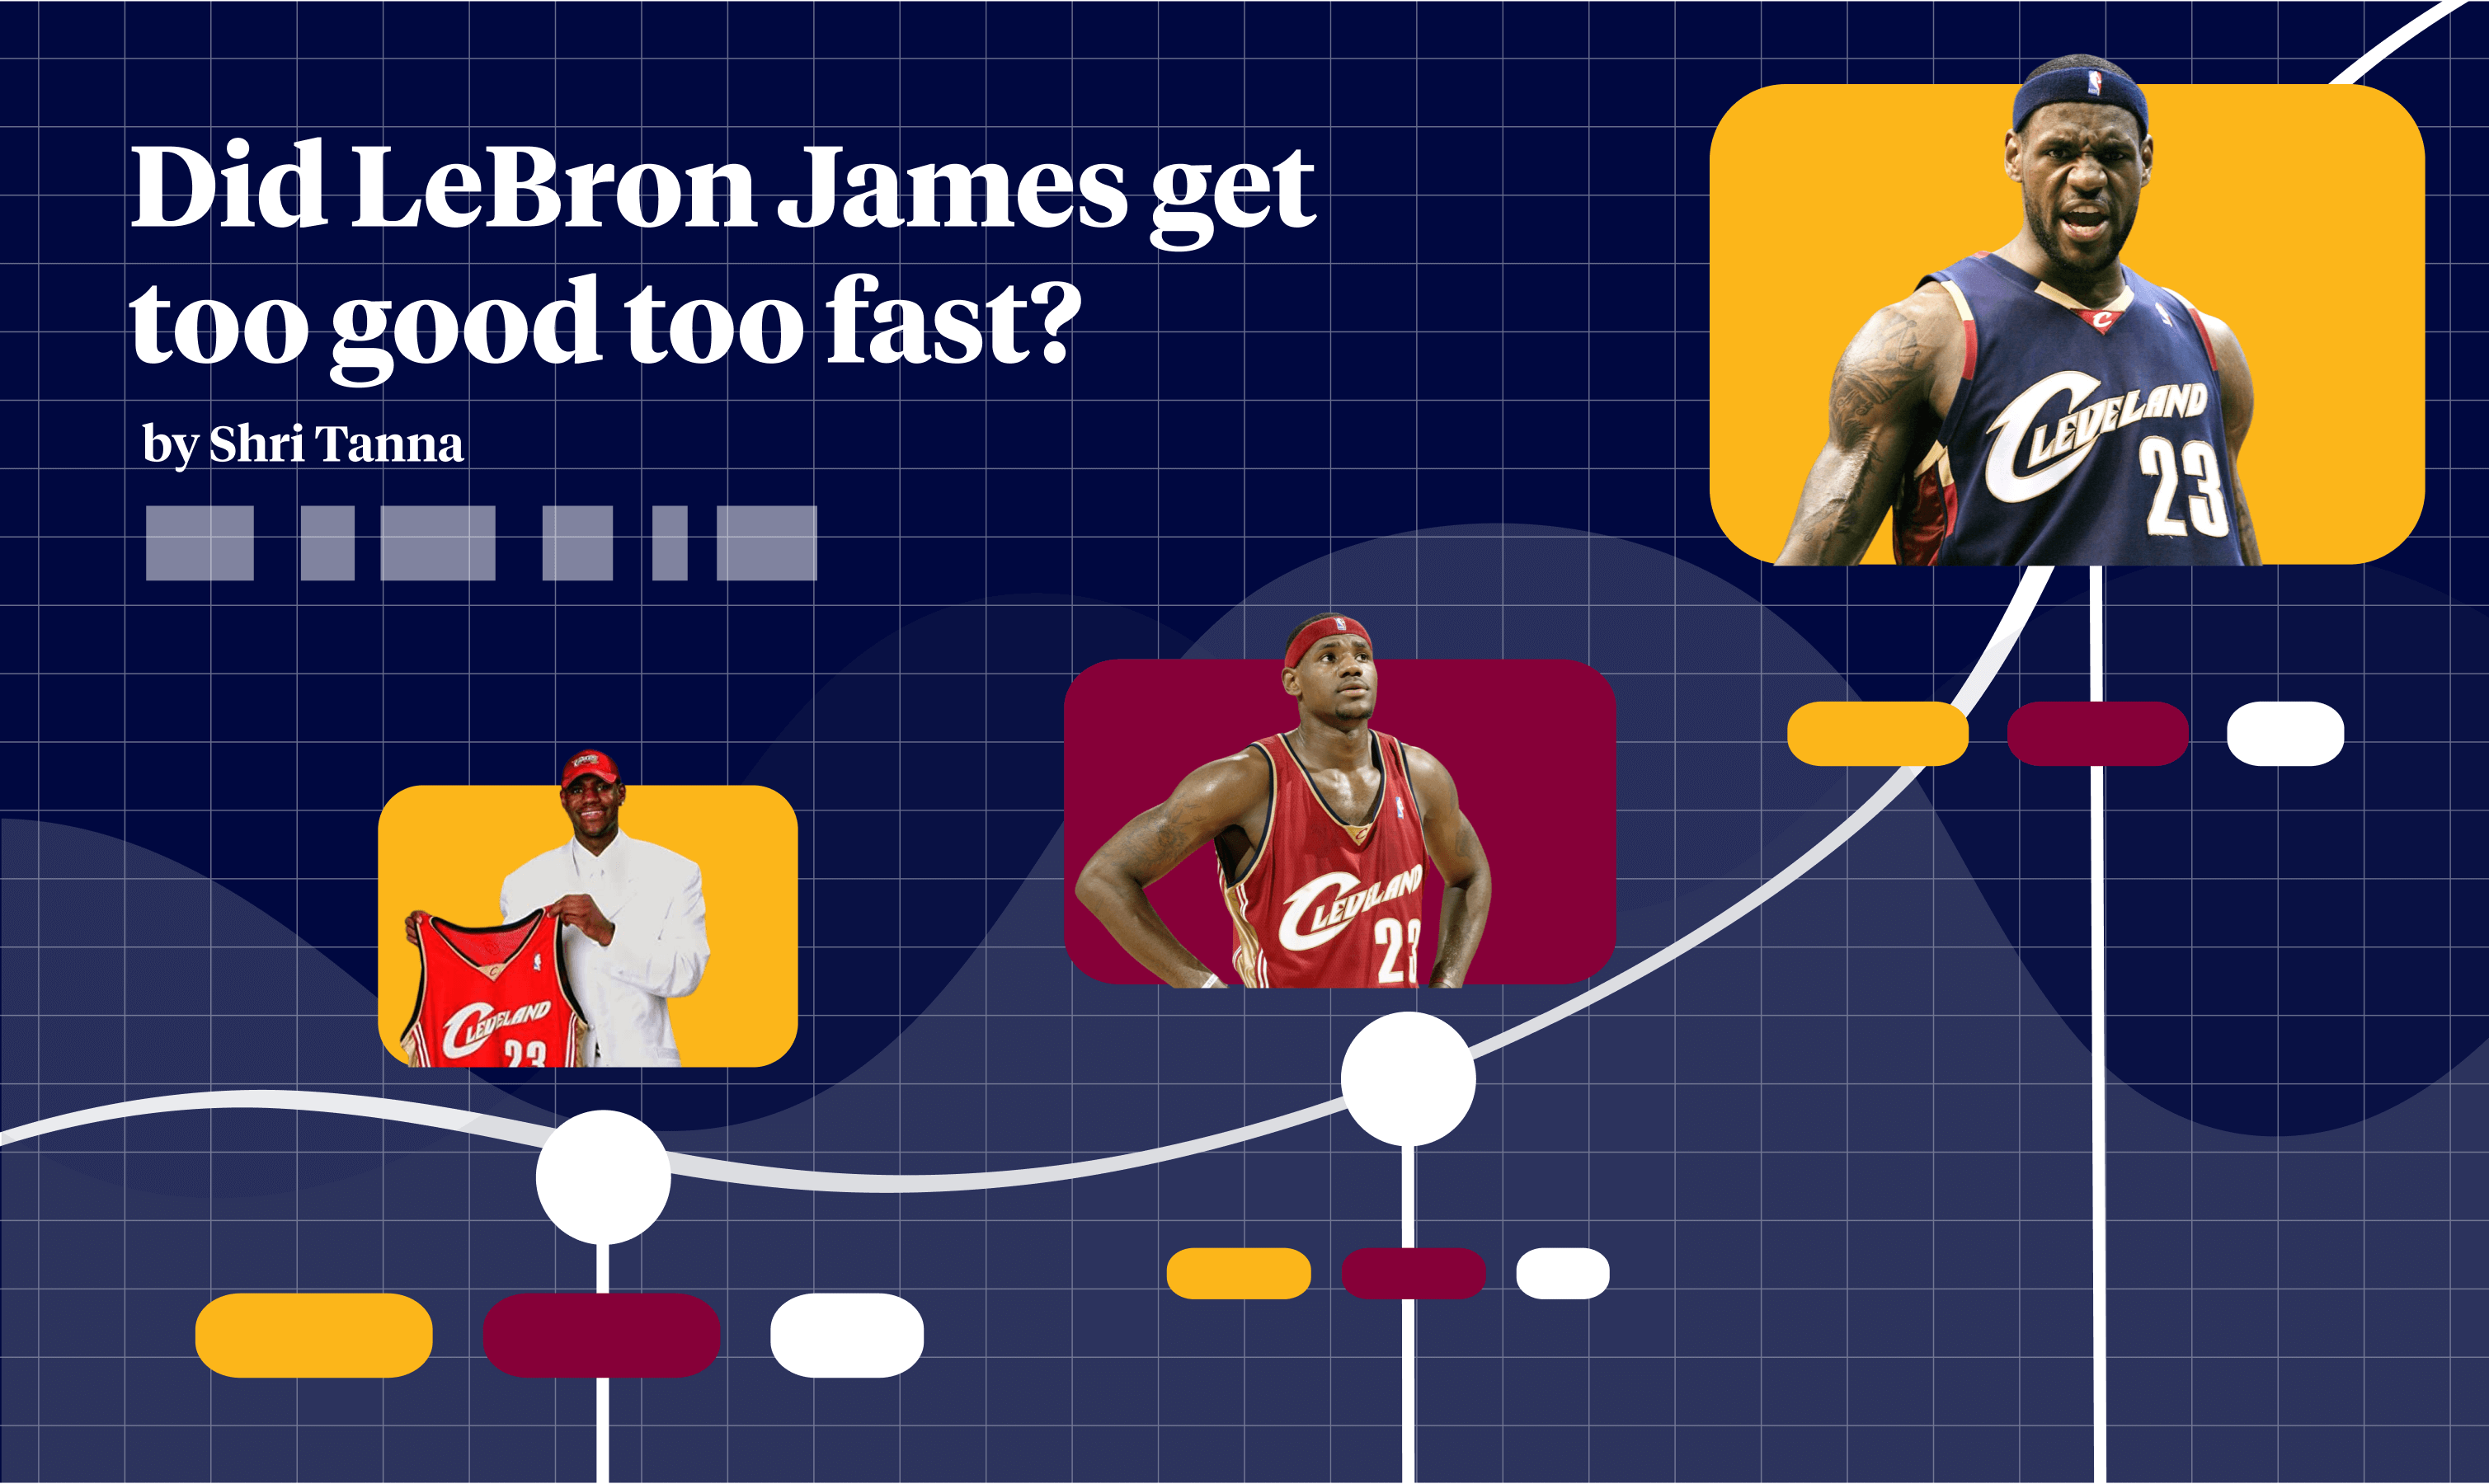
NBAA retrospective and thought experiment on LeBron James' first Cleveland stint.
By Shri Khalpada
 NBA
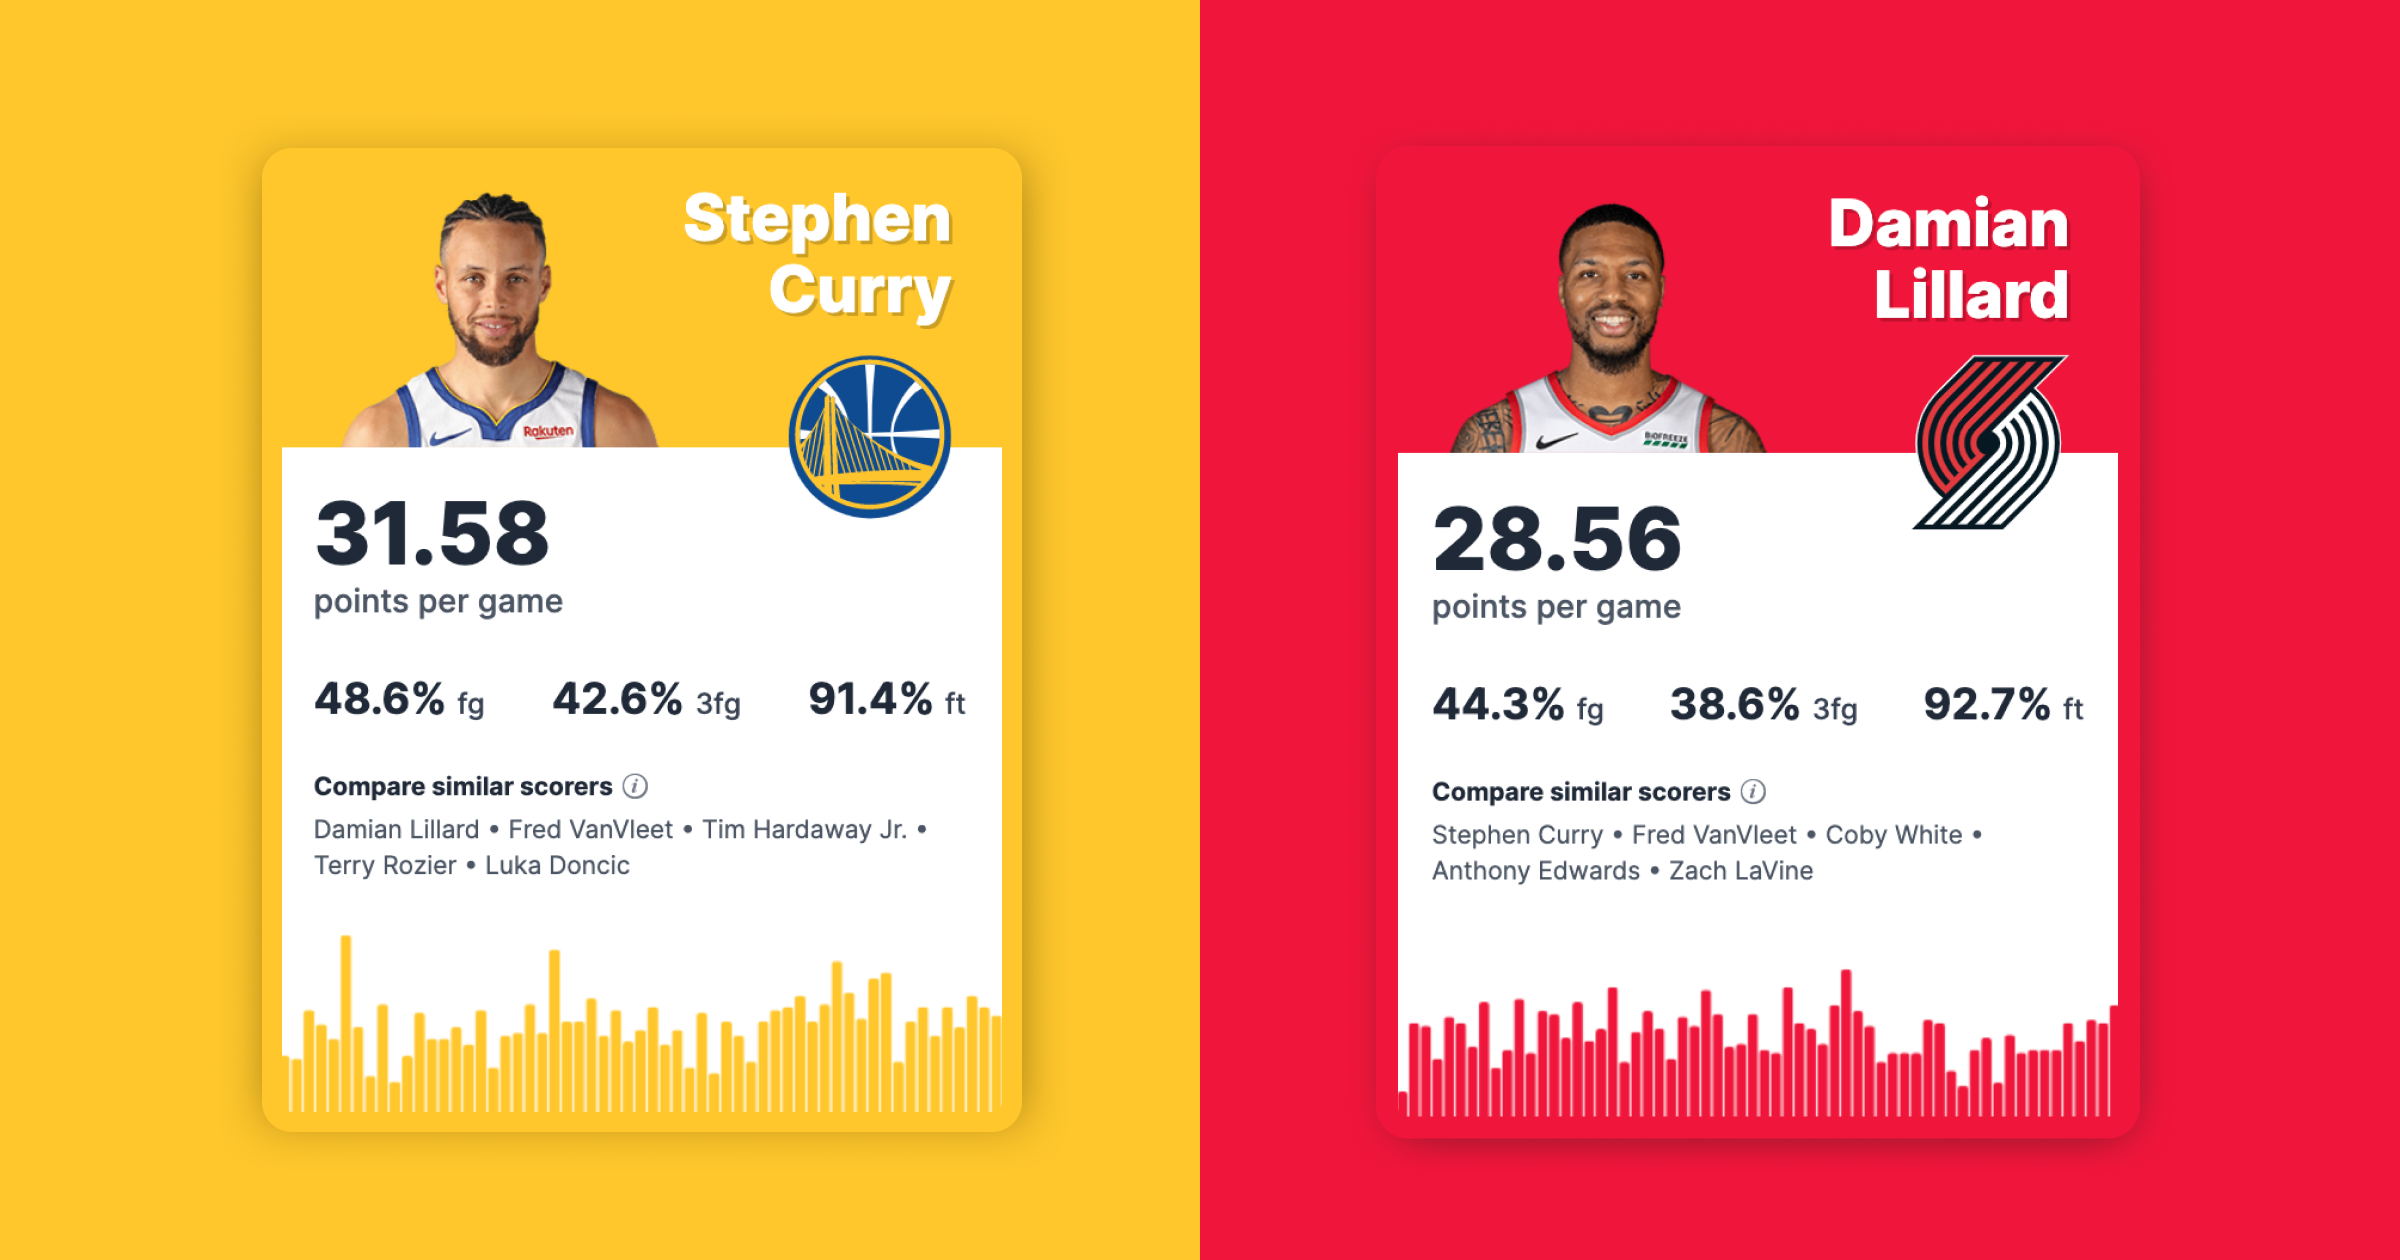
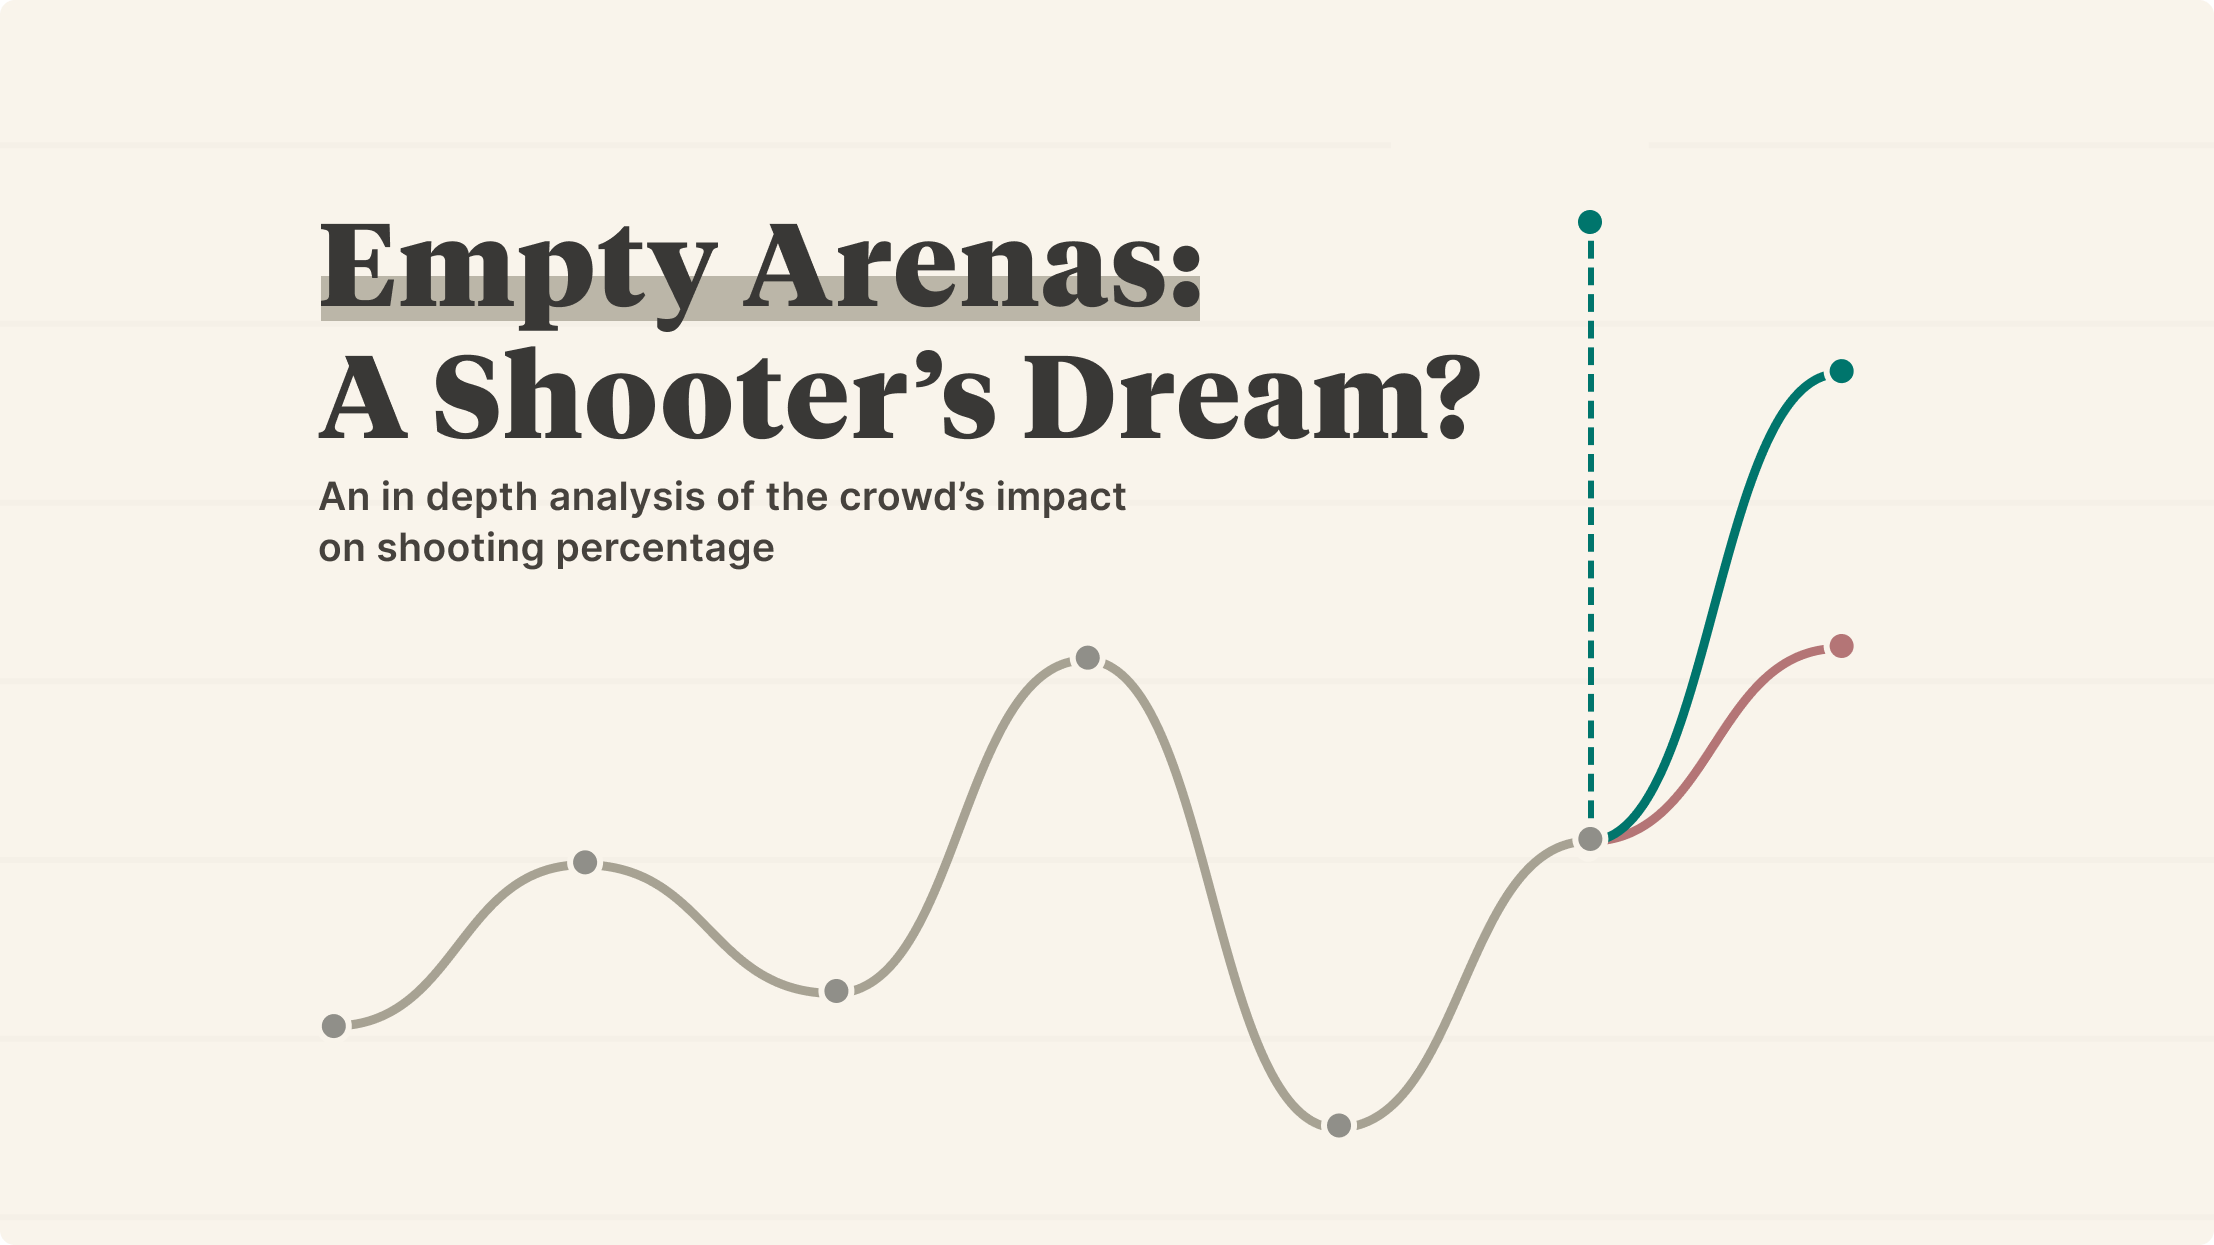
NBAAn in depth analysis of a crowd's impact on shooting percentage.
By Shri Khalpada & Rob Moore
 NFL
NFLEvery NFL franchise graded on two decades of drafting.
By Rob Moore
 NFL
NFLComplete draft analysis with redraft rankings and team performance grades.
By Rob Moore
 NFL
NFLExplore the most exciting NFL games using play-by-play win probability analysis.
By Rob Moore
 NFL
NFLExplore every NFL score ever with our interactive visualization.
By Shri Khalpada & Rob Moore
 NFL
NFLExplore 20 years of NFL draft surprises.
By Rob Moore
 NFL
NFLExplore over 25 years of upsets and blowouts.
By Shri Khalpada & Rob Moore
 NFL
NFLEvery NFL team ranked at every position, based on twenty years of draft outcomes.
By Rob Moore
 NFL
NFLEvery pick-for-pick trade from the 2026 NFL Draft, scored by the best-player test.
By Rob Moore
 NFL
NFLWhat should a team expect from each pick slot? Building a baseline from 15 years of data.
By Rob Moore
 NFL
NFLA value-above-replacement metric for NFL draft picks, built on per-snap grades, career stats, and awards.
By Rob Moore
 NFL
NFLExplore the final standings of each season in the NFL since the division re-alignment.
By Rob Moore
 WORLD
WORLDAn interactive exploration of American wealth inequality using data visualizations.
By Shri Khalpada
 WORLD
WORLDA data-driven analysis of voter fraud claims, their real-world impact, and the misleading narratives that fuel them.
By Shri Khalpada
 WORLD
WORLDVisualize climate change data with a 3D globe.
By Shri Khalpada
 WORLD
WORLDExplore regulatory job data with interactive visualizations.
By Rob Moore & Shri Khalpada
 WORLD
WORLDA thought experiment for infinite feeds on physical media.
By Shri Khalpada
 WORLD
WORLDVisualizing Consumer Price Index data across eight categories.
By Shri Khalpada
 WORLD
WORLDExplore global wealth inequality with an interactive visualization.
By Shri Khalpada
 CRAFT
CRAFTA creative technologist's perspective on AI-generated music.
By Shri Khalpada
 CRAFT
CRAFTThe case for less rigor and more nuance.
By Shri Khalpada
 CRAFT
CRAFTA collection of 30 hands-on p5.js sketches designed to inspire creative coding. Explore generative art, animation, and interactive design through playful experimentation.
By Shri Khalpada
 CRAFT
CRAFTA collection of 31 creative coding sketches for Genuary 2025.
By Shri Khalpada
 CRAFT
CRAFTA gentle introduction to interactive data visualization.
By Shri Khalpada
 CRAFT
CRAFTDiving into different ways to visualize happiness data.
By Shri Khalpada